Minor League Attendance Snaps Back To Pre-Pandemic Form

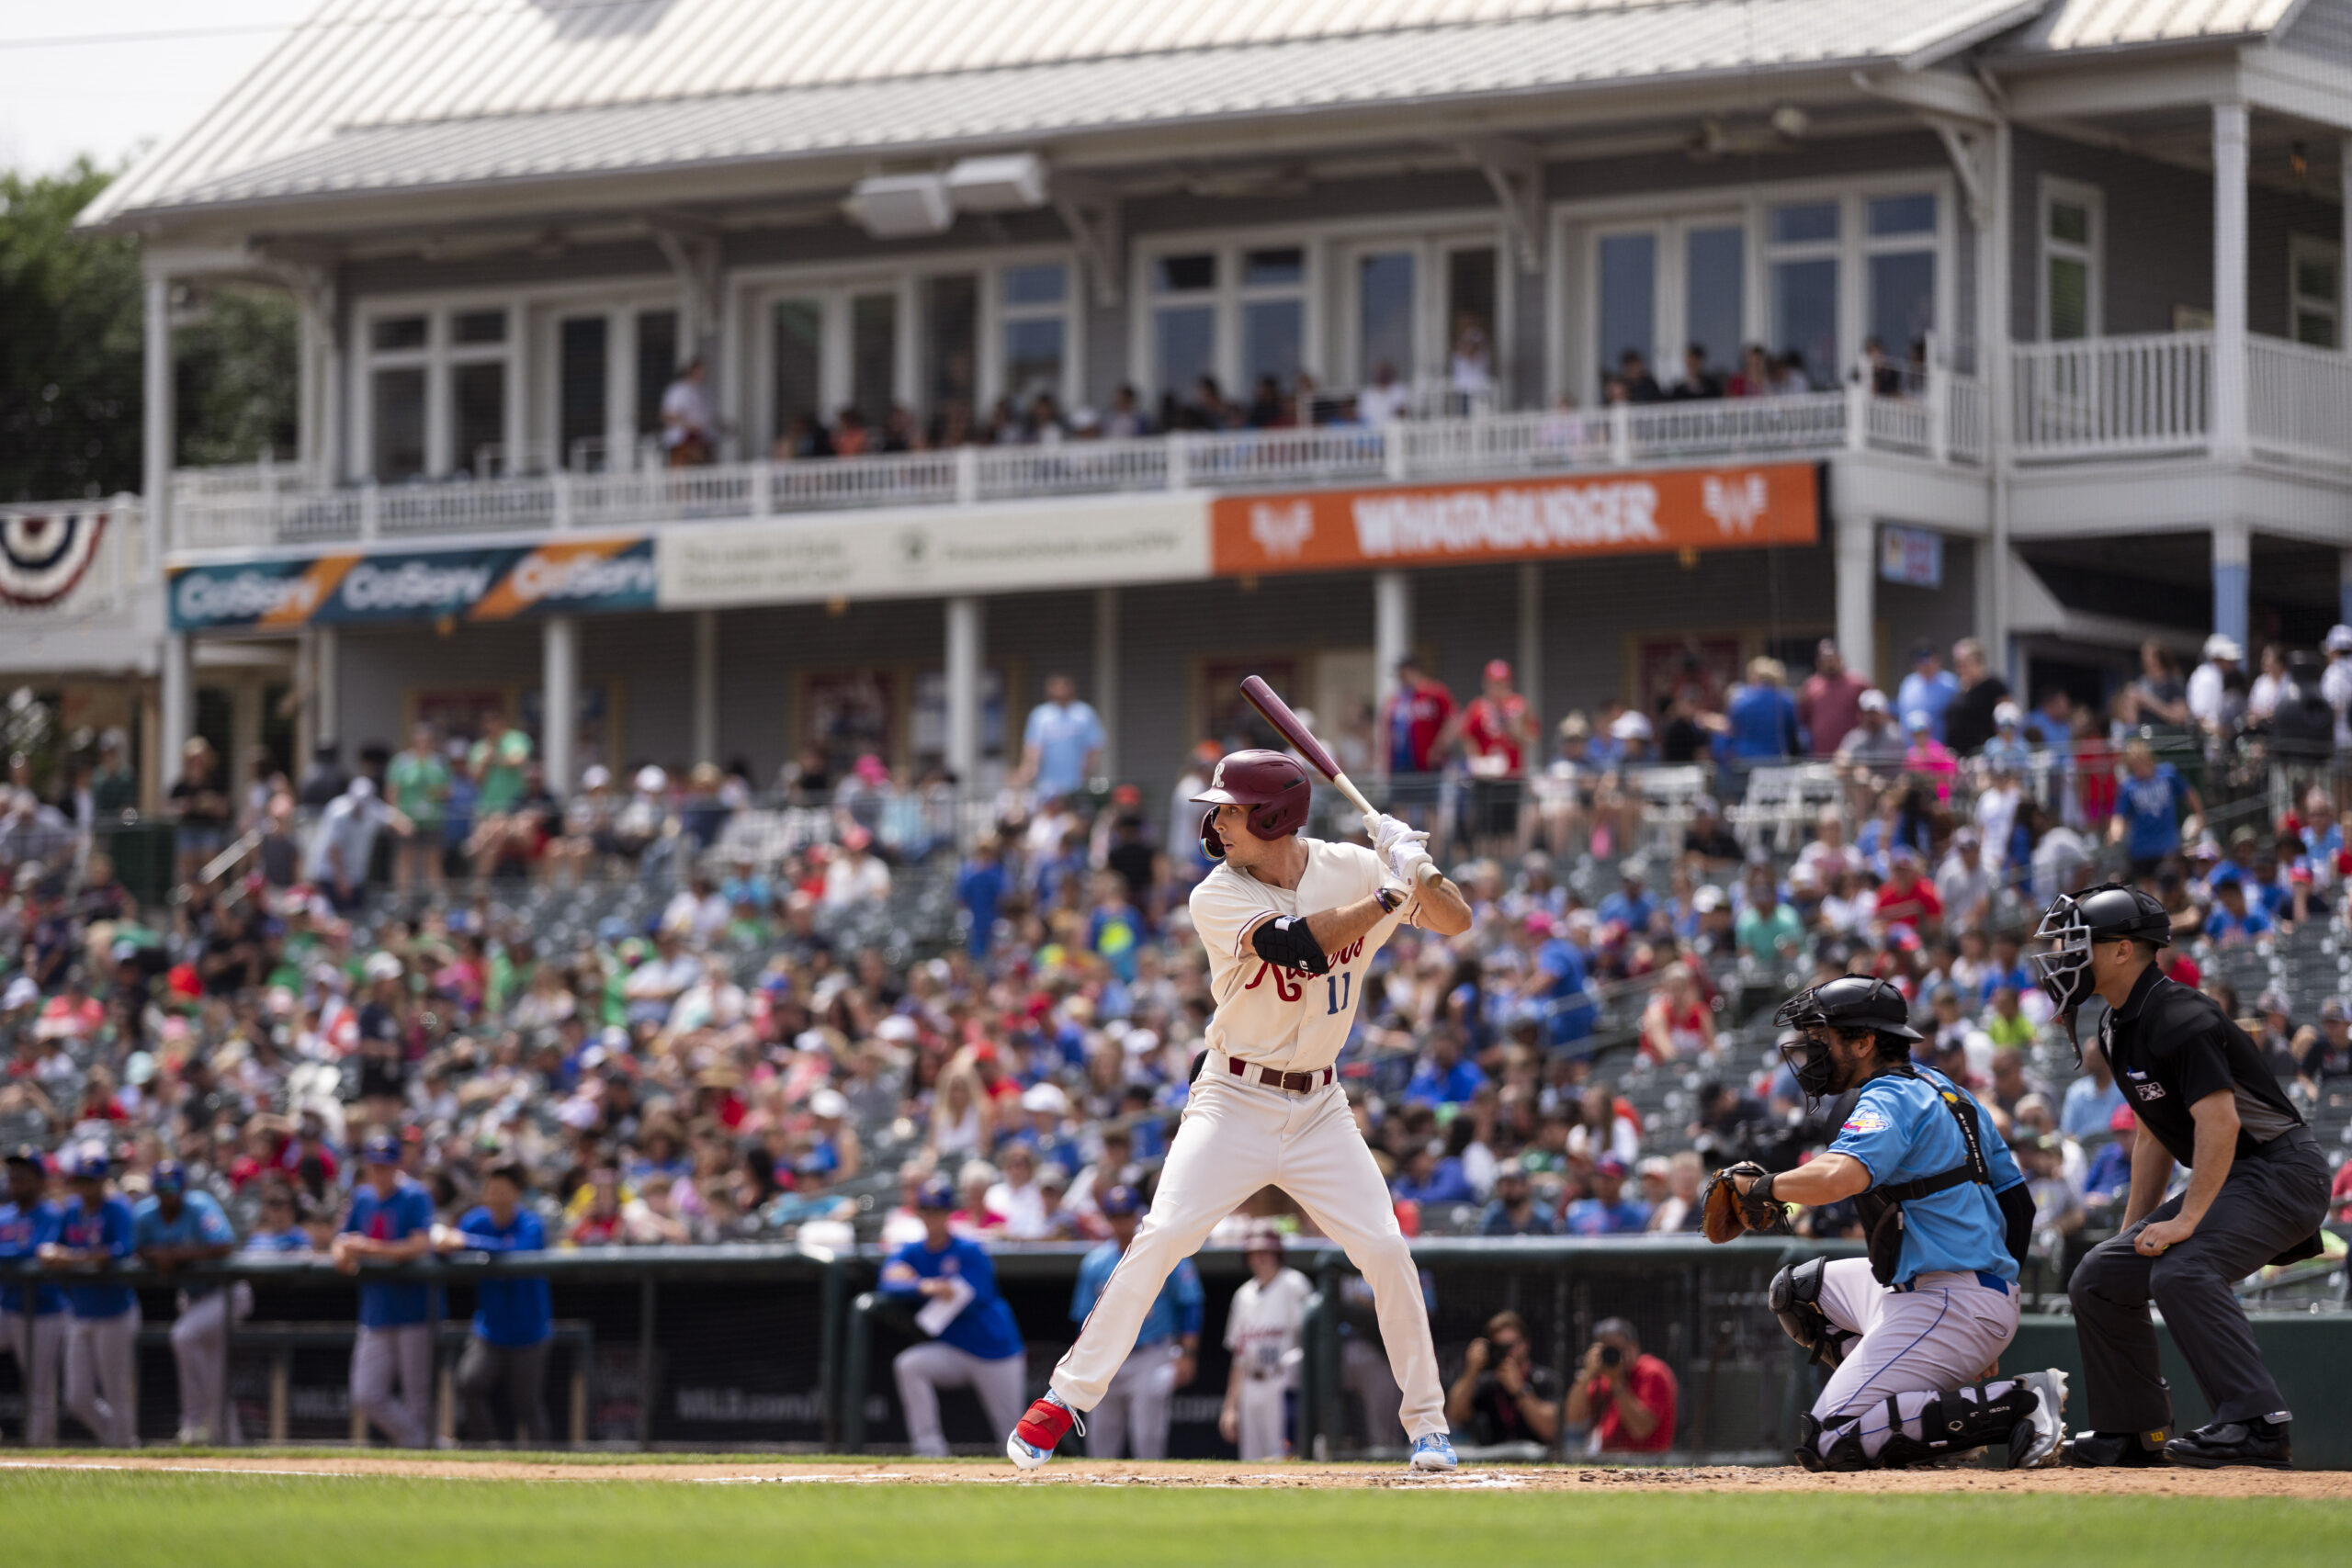
Image credit: (Photo by Ben Ludeman/Texas Rangers/Getty Images)
UPDATE: You can now see full 2023 Minor League Baseball attendance numbers here.
The last few years have been brutal ones for many who work in minor league baseball.
There was the lost 2020 season. There were furloughs, layoffs and payroll cuts that proved to be an off-ramp for a number of longtime minor league front office employees.
Right on the heels of that came the MLB-mandated scaling back of the minor leagues from 160 affiliated ticket-selling teams to 120.
The effects of the coronavirus pandemic didn’t end there. When the minors returned in 2021, there were still capacity restrictions for many teams, and there was still a reluctance by some to return to games.
Last year was supposed to be the return to normalcy, but when the season wrapped, teams across the minors faced a new realm of fears. Attendance across the minors was down 380 fans per game per team compared with 2019, the last year before the pandemic. Some expressed concern that the new sea level for minor league attendance had dipped significantly.
Minor league attendance hasn’t really grown since 2007, when a record 43.26 million fans came to games, an average of 4,170 fans per game. While there’s no hope that the slimmed-down minor leagues will ever again come close to that 43 million total attendance record, throughout the 2010s, the minors had found a nice equilibrium. Most years, the average team drew a little more than 4,000 fans per game.
In 2022, the average team drew just 3,910 fans per game. If that was the new normal, it would mean that it had settled in at a level worse than what Minor League Baseball had seen in any year since the start of the 21st century.
Now, a collective sigh of relief can be heard around the minors. Last year appears to be an aberration. This year looks a whole lot more like 2019 than it does 2022.
As of July 23, MiLB teams were averaging 4,034 fans per team per game. That’s up 124 fans per game across the minors when compared with the end-of-year totals for 2022. Even better for MiLB teams, it’s a 207 fan per game increase over where they were at this time last year.
And it’s just seven fans per game fewer than teams drew in 2019 through July 23.
So what happened? In conversations with front office officials with multiple teams, groups have returned to the ballpark in 2023 in a way they didn’t in 2022. While season-ticket sales and single-game tickets returned to pre-pandemic levels last year, civic groups and corporate outings remained hard to book in 2022.
This year, those groups are back.
“This feels the most normal since 2019. We’re seeing that group element come back to the ballpark now,” Gwinnett Stripers general manager Erin McCormick said. The Stripers are on pace for their best attendance since 2015.
According to McCormick, last year some groups were still hesitant to come back to the ballpark because of the pandemic. Others said they needed a year of steady revenues before they were able to do staff outings. This year, both those concerns have largely evaporated.
“In 2021, it was a short season; (in) 2022 there were still a lot of unknowns,” McCormick said. “Now this is the first year where it’s a sigh of relief. We’re back. Now we can focus on what we’re doing and grow on that.”
The gains can be seen nearly across the board. Of the 100 teams that had been full-season clubs in 2019, 62 drew fewer fans per game and 27 drew more than 500 fewer fans per game in 2022 than they did in 2019. Just 16 teams saw bumps of 500 or more fans per game when compared with 2019.
This year, 91 of the 120 affiliated teams have seen attendance gains compared to this time last year, and 10 teams were up 500 fans per game or more. Only New Hampshire had seen a drop of 500 or more fans per game.
There’s also something notable afoot. The Twins’ Double-A Wichita affiliate has seen an increase of 1,606 fans per game when compared to this time last year, the biggest increase in the minors. But after them, the next three biggest gainers were all Orioles affiliates.
The Orioles have been one of the best success stories in baseball in 2023, and they have spread the prospect wealth around to all levels. Our No. 1 prospect Jackson Holliday has played at three different levels. Triple-A Norfolk, the only team to not see Holliday yet this year, began the year with what we described as the most talented team in the minors.
The Tides lived up to those expectations with the best record in the International League, all while sending a steady stream of prospects to Baltimore throughout the season.
“Previous (Orioles front offices) would send guys straight from Double-A to the majors,” Norfolk GM Joe Gregory said. “Manny Machado never played here. Now that we’re getting those players for a significant amount of at-bats, the fans in Norfolk see them here longer and then go to Baltimore and make that impact. It’s positive all the way around.”
The Orioles’ ability to keep their farm teams within their geographical footprint has provided a halo effect. Norfolk was up by 1,069 fans per game. Double-A Bowie was up 1,041 per game. Low-A Delmarva had seen a bump of 923 fans per game. High-A Aberdeen cracked the top 20 in attendance growth with an increase of 427 fans per game.
The Orioles’ success had helped the big league team draw more than 4,000 additional fans per game when compared to this time last year. That success had trickled down to Baltimore affiliates, which had collectively drawn 3,460 more fans per game this year.
Return To Form
Minor league attendance has returned to pre-pandemic levels in 2023. Here’s a look at what the 120 full-season clubs were drawing in average announced attendance through July 23 in each year.
Year Attendance per game
2023 4,034
2022 3,830
2021 3,065
2019 4,041
2018 4,051
2017 4,185
2016 4,105
2015 4,188
2014 4,149
2013 4,088
2012 4,064
2011 4,118
2010 4,158
MLB Attendance Has Also Climbed in 2023 to levels not seen since 2017. Here’s a look at average announced MLB attendance through July 23 of each season.
Year Avg. Attendance
2023 28,775
2022 26,525
2021 15,949
2019 28,173
2018 28,555
2017 30,308
2016 30,398
2015 30,456
2014 30,223
2013 30,460
2012 31,405
2011 30,005
2010 29,784
Here’s a look at each team’s average attendance through July 23, 2023, along with their average at the same time last year and their percentage change.
| Team | 2023 | 2022 | Change | % Change |
| Wichita Wind Surge | 4,895 | 3,289 | 1,606 | 48.83% |
| Norfolk Tides | 6,009 | 4,940 | 1,069 | 21.64% |
| Bowie Baysox | 3,572 | 2,531 | 1,041 | 41.13% |
| Delmarva Shorebirds | 3,184 | 2,261 | 923 | 40.82% |
| Binghamton Rumble Ponies | 3,084 | 2,237 | 847 | 37.86% |
| Wilmington Blue Rocks | 2,633 | 1,913 | 720 | 37.64% |
| South Bend Cubs | 4,776 | 4,203 | 573 | 13.63% |
| Frisco RoughRiders | 5,573 | 5,026 | 547 | 10.88% |
| Corpus Christi Hooks | 4,606 | 4,084 | 522 | 12.78% |
| Northwest Arkansas Naturals | 4,036 | 3,532 | 504 | 14.27% |
| Durham Bulls | 6,780 | 6,288 | 492 | 7.82% |
| Portland Sea Dogs | 6,132 | 5,640 | 492 | 8.72% |
| Lehigh Valley IronPigs | 7,999 | 7,522 | 477 | 6.34% |
| Cedar Rapids Kernels | 2,441 | 1,979 | 462 | 23.35% |
| Erie SeaWolves | 2,897 | 2,438 | 459 | 18.83% |
| Gwinnett Stripers | 3,406 | 2,952 | 454 | 15.38% |
| Harrisburg Senators | 4,125 | 3,673 | 452 | 12.31% |
| Mississippi Braves | 2,896 | 2,457 | 439 | 17.87% |
| Aberdeen IronBirds | 2,195 | 1,768 | 427 | 24.15% |
| Springfield Cardinals | 4,105 | 3,692 | 413 | 11.19% |
| Sugar Land Space Cowboys | 4,411 | 3,999 | 412 | 10.30% |
| Hartford Yard Goats | 6,190 | 5,790 | 400 | 6.91% |
| Fort Wayne TinCaps | 5,089 | 4,704 | 385 | 8.18% |
| Charleston RiverDogs | 4,294 | 3,910 | 384 | 9.82% |
| Stockton Ports | 1,846 | 1,466 | 380 | 25.92% |
| Jersey Shore BlueClaws | 4,431 | 4,057 | 374 | 9.22% |
| Asheville Tourists | 2,984 | 2,620 | 364 | 13.89% |
| Reading Fightin Phils | 6,114 | 5,755 | 359 | 6.24% |
| Palm Beach Cardinals | 958 | 613 | 345 | 56.28% |
| Arkansas Travelers | 4,815 | 4,474 | 341 | 7.62% |
| Biloxi Shuckers | 2,625 | 2,284 | 341 | 14.93% |
| Altoona Curve | 4,569 | 4,233 | 336 | 7.94% |
| Tacoma Rainiers | 5,030 | 4,709 | 321 | 6.82% |
| Salt Lake Bees | 5,862 | 5,544 | 318 | 5.74% |
| Greensboro Grasshoppers | 4,459 | 4,144 | 315 | 7.60% |
| Peoria Chiefs | 2,272 | 1,957 | 315 | 16.10% |
| Hickory Crawdads | 2,062 | 1,758 | 304 | 17.29% |
| Pensacola Blue Wahoos | 4,543 | 4,242 | 301 | 7.10% |
| Tennessee Smokies | 4,634 | 4,338 | 296 | 6.82% |
| Akron RubberDucks | 3,809 | 3,519 | 290 | 8.24% |
| West Michigan Whitecaps | 5,115 | 4,826 | 289 | 5.99% |
| Everett AquaSox | 1,943 | 1,660 | 283 | 17.05% |
| Spokane Indians | 3,653 | 3,375 | 278 | 8.24% |
| Jupiter Hammerheads | 1,014 | 741 | 273 | 36.84% |
| Richmond Flying Squirrels | 6,439 | 6,167 | 272 | 4.41% |
| Scranton/Wilkes-Barre RailRiders | 4,865 | 4,595 | 270 | 5.88% |
| Great Lakes Loons | 2,686 | 2,421 | 265 | 10.95% |
| Rancho Cucamonga Quakes | 2,389 | 2,126 | 263 | 12.37% |
| Buffalo Bisons | 6,975 | 6,715 | 260 | 3.87% |
| Chattanooga Lookouts | 3,860 | 3,608 | 252 | 6.98% |
| Sacramento River Cats | 5,161 | 4,921 | 240 | 4.88% |
| Augusta GreenJackets | 4,321 | 4,083 | 238 | 5.83% |
| Toledo Mud Hens | 6,049 | 5,821 | 228 | 3.92% |
| Rochester Red Wings | 6,069 | 5,845 | 224 | 3.83% |
| Fort Myers Mighty Mussels | 1,860 | 1,643 | 217 | 13.21% |
| Hillsboro Hops | 2,249 | 2,040 | 209 | 10.25% |
| Lynchburg Hillcats | 1,706 | 1,499 | 207 | 13.81% |
| Syracuse Mets | 5,210 | 5,009 | 201 | 4.01% |
| San Jose Giants | 1,914 | 1,719 | 195 | 11.34% |
| Bradenton Marauders | 1,089 | 904 | 185 | 20.46% |
| Carolina Mudcats | 2,465 | 2,280 | 185 | 8.11% |
| Columbia Fireflies | 3,663 | 3,489 | 174 | 4.99% |
| Hudson Valley Renegades | 2,763 | 2,589 | 174 | 6.72% |
| El Paso Chihuahuas | 7,077 | 6,909 | 168 | 2.43% |
| Dunedin Blue Jays | 547 | 389 | 158 | 40.62% |
| Columbus Clippers | 7,569 | 7,413 | 156 | 2.10% |
| Rome Braves | 1,652 | 1,501 | 151 | 10.06% |
| Fredericksburg Nationals | 4,102 | 3,953 | 149 | 3.77% |
| Iowa Cubs | 6,063 | 5,918 | 145 | 2.45% |
| Greenville Drive | 5,131 | 4,987 | 144 | 2.89% |
| Tri-City Dust Devils | 1,752 | 1,612 | 140 | 8.68% |
| Indianapolis Indians | 7,634 | 7,500 | 134 | 1.79% |
| Oklahoma City Dodgers | 5,876 | 5,742 | 134 | 2.33% |
| Bowling Green Hot Rods | 2,629 | 2,501 | 128 | 5.12% |
| Reno Aces | 4,866 | 4,741 | 125 | 2.64% |
| Brooklyn Cyclones | 2,685 | 2,566 | 119 | 4.64% |
| Winston-Salem Dash | 4,478 | 4,367 | 111 | 2.54% |
| Visalia Rawhide | 2,038 | 1,937 | 101 | 5.21% |
| Wisconsin Timber Rattlers | 2,944 | 2,843 | 101 | 3.55% |
| Down East Wood Ducks | 1,616 | 1,526 | 90 | 5.90% |
| Tampa Tarpons | 1,007 | 937 | 70 | 7.47% |
| Omaha Storm Chasers | 4,077 | 4,010 | 67 | 1.67% |
| Lake Elsinore Storm | 1,763 | 1,711 | 52 | 3.04% |
| Round Rock Express | 5,740 | 5,700 | 40 | 0.70% |
| Fresno Grizzlies | 4,316 | 4,283 | 33 | 0.77% |
| Beloit Sky Carp | 1,479 | 1,447 | 32 | 2.21% |
| Kannapolis Cannon Ballers | 3,071 | 3,046 | 25 | 0.82% |
| Amarillo Sod Poodles | 5,565 | 5,542 | 23 | 0.42% |
| Lansing Lugnuts | 4,417 | 4,394 | 23 | 0.52% |
| Lakeland Flying Tigers | 652 | 641 | 11 | 1.72% |
| Jacksonville Jumbo Shrimp | 5,352 | 5,344 | 8 | 0.15% |
| Montgomery Biscuits | 2,694 | 2,710 | -16 | -0.59% |
| Dayton Dragons | 7,878 | 7,902 | -24 | -0.30% |
| Clearwater Threshers | 2,630 | 2,658 | -28 | -1.05% |
| Salem Red Sox | 2,770 | 2,807 | -37 | -1.32% |
| Las Vegas Aviators | 7,008 | 7,046 | -38 | -0.54% |
| Quad Cities River Bandits | 2,522 | 2,574 | -52 | -2.02% |
| Somerset Patriots | 5,080 | 5,134 | -54 | -1.05% |
| Daytona Tortugas | 1,545 | 1,606 | -61 | -3.80% |
| Birmingham Barons | 4,143 | 4,205 | -62 | -1.47% |
| Midland RockHounds | 3,666 | 3,737 | -71 | -1.90% |
| San Antonio Missions | 4,286 | 4,359 | -73 | -1.67% |
| Vancouver Canadians | 4,449 | 4,539 | -90 | -1.98% |
| Nashville Sounds | 7,909 | 8,002 | -93 | -1.16% |
| St. Lucie Mets | 1,169 | 1,291 | -122 | -9.45% |
| Myrtle Beach Pelicans | 4,075 | 4,211 | -136 | -3.23% |
| Lake County Captains | 2,631 | 2,810 | -179 | -6.37% |
| Tulsa Drillers | 5,599 | 5,791 | -192 | -3.32% |
| Louisville Bats | 5,641 | 5,855 | -214 | -3.65% |
| Inland Empire 66ers | 2,109 | 2,333 | -224 | -9.60% |
| St. Paul Saints | 5,927 | 6,176 | -249 | -4.03% |
| Eugene Emeralds | 1,792 | 2,066 | -274 | -13.26% |
| Modesto Nuts | 1,360 | 1,642 | -282 | -17.17% |
| Memphis Redbirds | 3,250 | 3,541 | -291 | -8.22% |
| Albuquerque Isotopes | 7,102 | 7,453 | -351 | -4.71% |
| Fayetteville Woodpeckers | 3,128 | 3,494 | -366 | -10.48% |
| Charlotte Knights | 7,115 | 7,483 | -368 | -4.92% |
| Rocket City Trash Pandas | 4,991 | 5,361 | -370 | -6.90% |
| Worcester Red Sox | 6,933 | 7,409 | -476 | -6.42% |
| New Hampshire Fisher Cats | 3,502 | 4,216 | -714 | -16.94% |
